How Much Time Do People Spend on Instagram?

Social Media Networks are booming in this Pandemic Era of 2020. People used to spend a considerable significant time just browsing through different social networking websites.
However, today, that time has increased because people rely on networking sites for their spare time and work, finances, businesses, shopping, events, and activities. Throughout this year, people’s dependence on their social media has increased because of the Pandemic’s real-world restrictions.
So, How Much Time Do People Spend on Instagram? Notably, based on the new COVID-19 Era and the 2020 Statistics.
Social Media and Instagram Usage
Social Media opens up users’ opportunity to voice their opinions, listen, engage, learn, and build new and existing relationships. Based on Instagram Statistics only in America, seven out of ten people use social networks to communicate, find entertaining content, and share information.
Due to this advanced usage and increased dependence, marketers, companies, and brands are forced to consider social media an essential aspect of reaching their consumers and building brand awareness.
Building a strong Digital Marketing Strategy has become a priority for any brand that would like to stand out among consumers. All because of How Much Time Users Spend on Social Media Platforms like Instagram.
Why Does Statistics Matter?
As mentioned, Social Media platforms like Instagram or Facebook have been part of our lives for some time now. Daily the number of people who sign up to these platforms increases by the second. Eleven People per Second start using some sort of platform for the first time. This stat is mind-boggling, considering in 2017 globally, there were only 2.5 Billion people on social media platforms.
However, today in 2020, there are 3.8 billion people, close to half the world’s population, on Social Media Platforms. So considering the statistics, it is a necessity to know the details.
The Time Users Spend On Instagram
Users on Instagram upload 870 Instagram photos per second, making 49,380 images per minute generated only on Instagram. In the U.S. alone, 73 percent of users between 13 to 24 years of age have direct access to the internet and have an account on Instagram. So after Facebook, it is the second most popular social networking website.
Henceforward in this article, we have pinpointed the Top Instagram Stats you would have to consider in 2020 and 2021.
#1. Instagram MAUs and DAUs
Out of the 3.8 Billion Active Users on Social Media Networking Platforms globally, Instagram holds over 1 Billion of those Monthly Active Users. (MAU). So, the Stats on Instagram are productive to your marketing strategy.
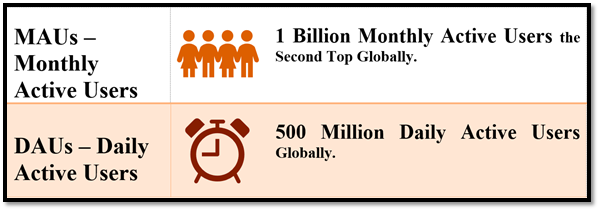
Five years ago, the statistics above were at only 130 Million Active Users, but today in 2020, it’s ten-fold what it used to be. Apart from Instagram, only Facebook with 2.6 Billion and YouTube with 2 Billion have more daily active users than Instagram. Hence, if you are considering whether you should invest in Instagram, we would say, Yes.
Although, 9.5 Percent or 95 Million of Instagram Users may be Fake Bots and Profiles. Which, according to Ghost Data Reports, may cost businesses and brands 1.3 Billion United States Dollars.
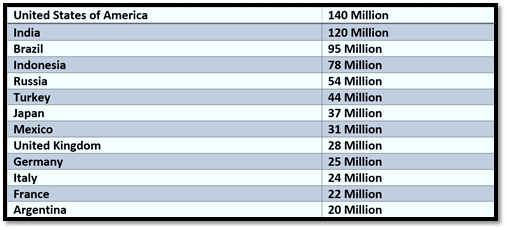
#2. Instagram Users By Country

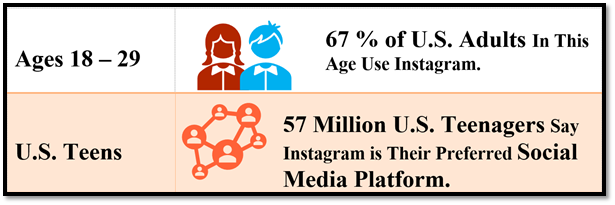
#3. Age Demographics
The Instagram Age and Gender Demographics; As of October 2020, Shows data that must be considered. These statistics will help you if you want to invest your brand and company within Instagram. The Distribution of Instagram Users globally based on age groups are as follow based on Percentage:
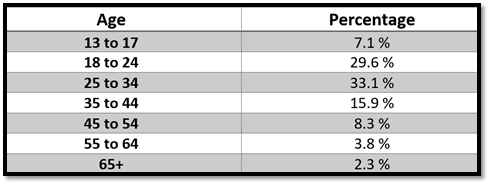
Among the User Demographics, some noticeable stats are:
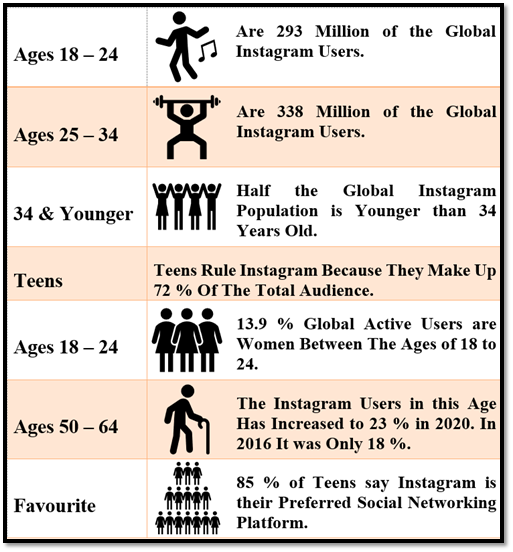
Interestingly the 85 % percent of teens say Instagram being their preferred Social Networking Site is a jump from 2017 when it was only 24 Percent.
#4. Age Demographics In The U.S.
The age demographics in the U.S. Shows:
#5. Gender Demographics
The Gender Demographics of Instagram and the United States Stats generally show that Women are slightly more active on Instagram than Men; this is also true in the United States.
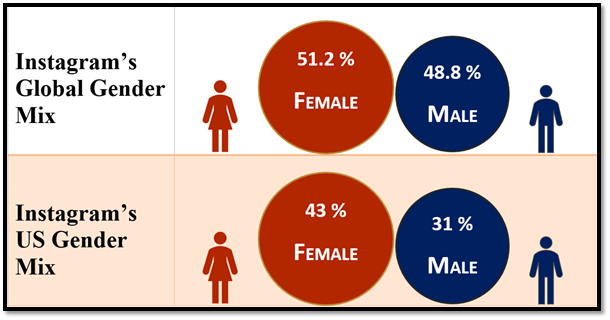
But generally, the Gender Mix among Instagram Users is more or less the same among both Males and Females.
#6. Instagram Log-Ins and Usage
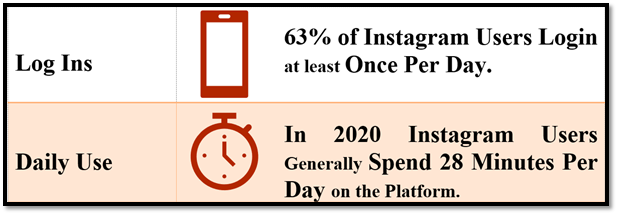
63% of Instagram Users Log-In to Instagram are once per day. That makes 630 Million Users a Day, who generally Spend at least 28 Minutes on Instagram. While Users under the age of 25 Spend 32 Minutes, and Users over 25 Years of Age use 24 Minutes Per Day on Instagram.

Instagram Stories Daily Views and Activities have surpassed its rival, SnapChat. Snap Chat with 150 Million DAU’s is nowhere close to Instagram’s 500 Million Daily Users.
#7. Instagram User Visits
The Instagram Daily Usage Stats only in the United States are as follows;
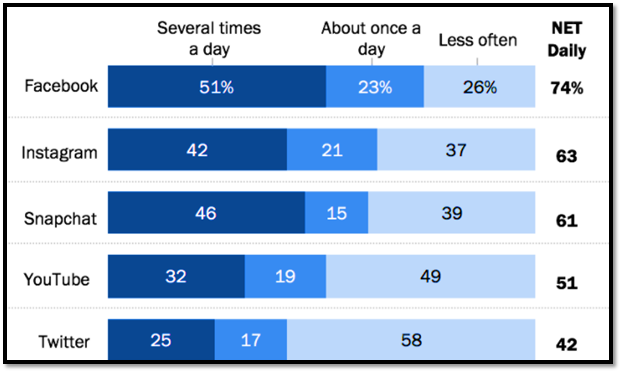
Among the Users in the United States of America, the data entails that users visit social media networking websites in the following regularities and percentages:
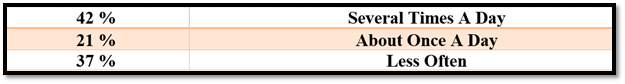
Only the Teen users considered in the Instagram Stats Confessed that they checked their Instagram Accounts on an Hourly Basis or even more frequently per hour daily.

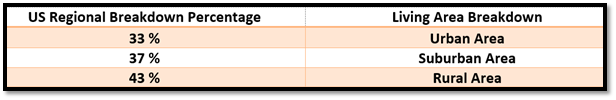
#8. Instagram’s US Location Demographics
The Instagram Location Demographics only in the US, and based on the 140 Million Users entails that Instagram accounts based on regional breakdowns are:
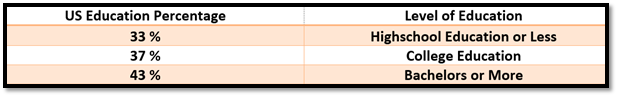
#9. Instagram’s US Education Demographics
Moreover, the Instagram Education Demographics for the United States are identified as:
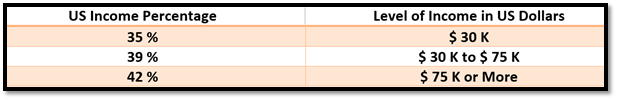
#10. Instagram’s US Income Demographics
The Instagram Income Demographics for the United States are as follows:
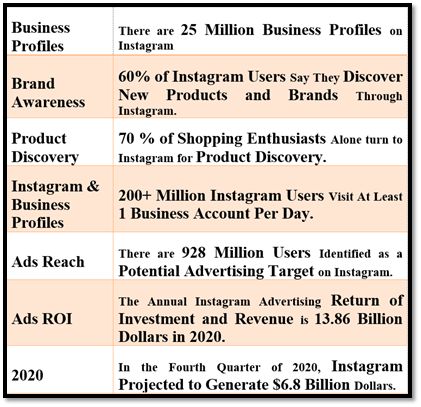
#11. Global Business Account Statistics
Instagram Users, in reference to Business Accounts on the same platform, shows the data:
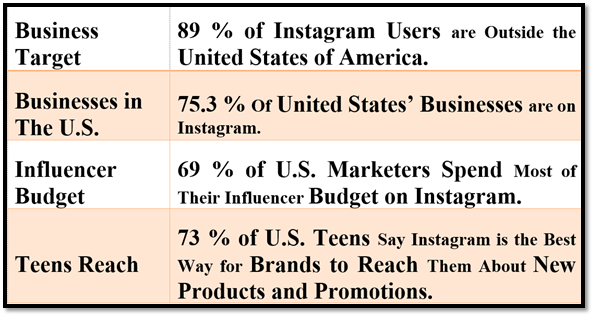
#12. United States Business Account Statistics
The Business Statistics that are relevant to the United States are as below:
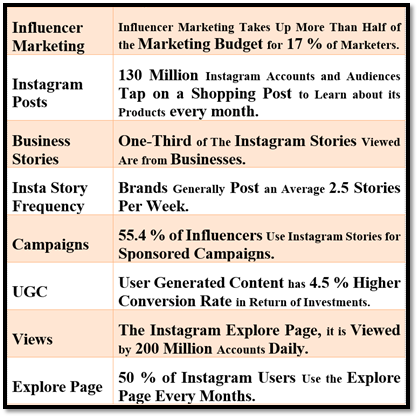
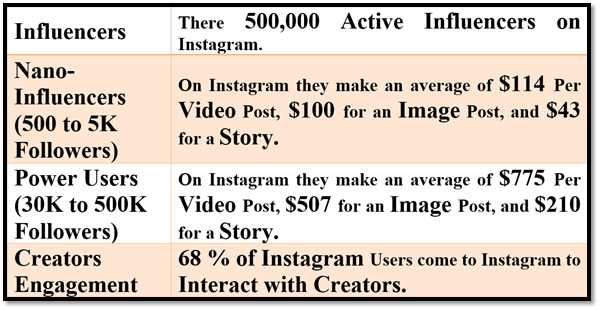
#13. Influencer Statistics
Since Influencers are one of the leading marketing strategies for social media marketers, it is best to be aware of the data around influencers on Instagram:
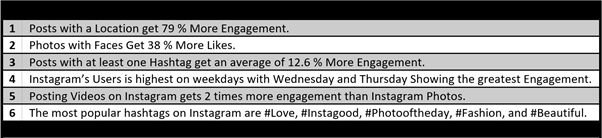
#14. Instagram Engagement Statistics
In Instagram Engagement Statistics, we have pinpointed data that can be used to your advantage in your Social Media Marketing Strategy. For example, the fact that; Posts with Locations get 79 % More Engagement is something that you would have to consider in your posts on Instagram. Or that Posts that have a face get 38 % more likes. These data could be used to your advantage in your marketing and Instagram strategy.
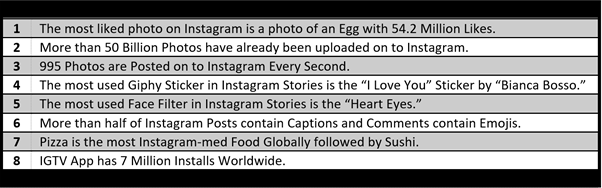
#15. Fun Statistics
Now that you know all the must-know statistics of How Much Time Users Spend on Instagram, you may also want to know some of the quirky and fun facts of Instagram Statistics.
#16. Instagram Penetration Statistics
To help you determine what Instagram penetration rate is and how it matters to your marketing strategy, you would need to know the exact percentages. To best understand what Instagram Penetration rate is in relevance to the different Countries population, smartphone owners, and Instagram users. Henceforward the Top 10 Countries with the largest Instagram Population are Listed. These data are fundamental because it will impact your marketing strategy in regards to your target audience.
All the following data are based on Statistics for December 2020.
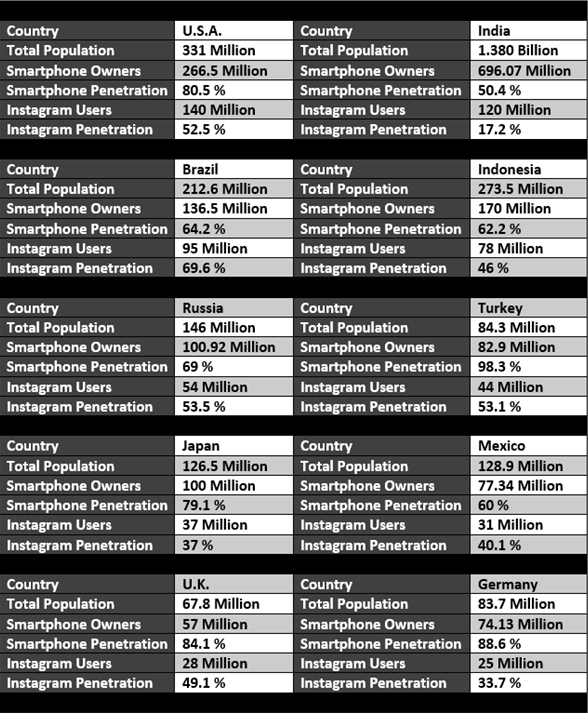
If you consider targeting a few countries at once, it is good to know the Instagram Penetration in each country to understand your target audience, engagement Rate, and Instagram Reach.
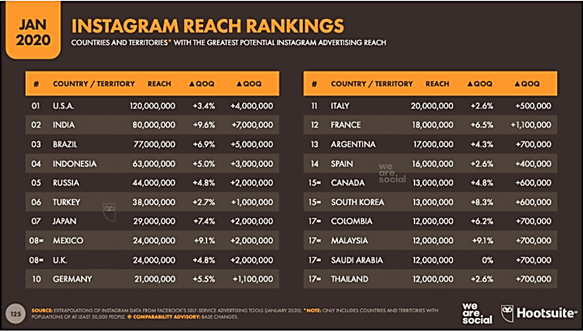
#17. Instagram Engagement Ranking
89 Percent of the Instagram audiences and community live outside of the United States. So when considering Advertising for your International Brand on Instagram, you would have to involve the top three potential countries within your advertising Engagement Reach. These Countries involve the U.S., India, and Brazil.
Conclusion
Here we are with a compact guide to all the statistics, numbers, and data you would need to know about How Much Time Do Users Spend On Instagram. Using these data, you can certainly create an excellent Digital Marketing and Social Media Marketing Strategy that could complement your Business, Brand, and Target Audience.
These Statistics though tough to bring together, are a necessity for any marketer. So, keep yourself up-to-date if you want the upper hand in the ever-changing social media networking market.
PS: All the following Data is based on Statistics between October to December 2020.