YouTube Analytics Guide for Smarter Video Strategy
“Stop guessing, let your data do the heavy lifting: how to turn YouTube Analytics into a smart video growth strategy even total beginners can master.”
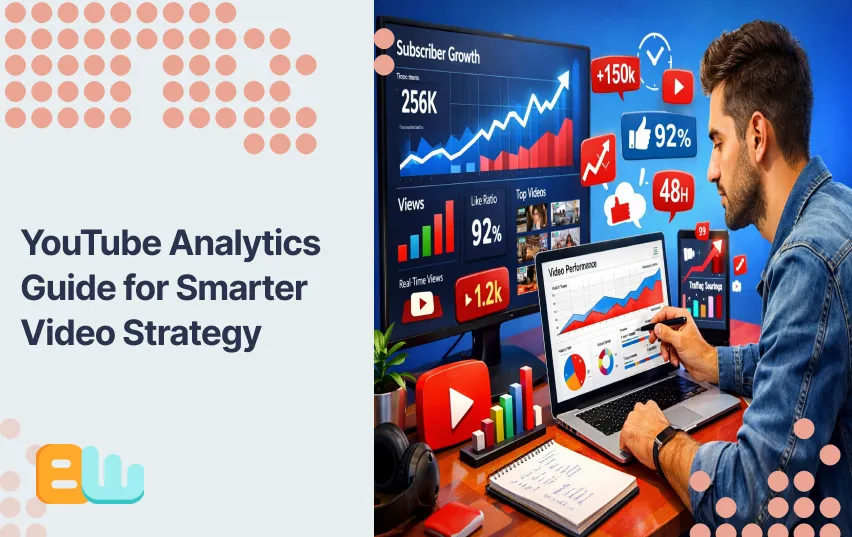
YouTube isn’t just about uploading videos anymore — it’s about understanding why some videos succeed while others don’t. That’s where YouTube Analytics comes in. For beginner creators, the analytics dashboard might look overwhelming, but once you learn to read the right metrics — and take action — you’ll unlock a data‑driven growth strategy that boosts views, engagement, watch time, and ultimately channel performance.
In this friendly, step‑by-step guide, you’ll learn:
- What key YouTube Analytics metrics really mean
- How to interpret them for strategic decisions
1. YouTube Analytics Basics — What It Is & Why It Matters
Before you can optimize your channel, you must understand what YouTube Analytics is and why it’s so important.
YouTube Analytics is a built‑in reporting tool inside YouTube Studio that shows you how viewers interact with your content. Forget raw views and subscriber counts — the metrics that matter most are those that show engagement, audience behavior, and viewer satisfaction. These metrics help YouTube’s algorithm decide when and how often to promote your videos.
📊 Key Sections of YouTube Analytics
- Overview: Quick snapshot of your channel performance
- Reach: Impressions, Click‑Through Rate (CTR), traffic sources
- Engagement: Watch time, Average View Duration, audience retention
- Audience: Who your viewers are and how often they return
- Revenue: Earnings insights if you’re monetized
Why it matters: Understanding these metrics helps you make informed decisions about what content to make next — instead of guessing.
A check list for beginners:
- Start with the Overview for a quick health check.
- Use Reach metrics to evaluate how your videos are discovered.
- Check Engagement for actual viewer satisfaction.
- Analyze Audience for demographics and returning viewers.
- Look at Revenue only if monetized, but still note trends.
2. Core YouTube Analytics Metrics Beginners Must Track
YouTube Analytics contains dozens of data points, but not all are equally useful — especially for beginners. Let’s break down the ones that truly influence growth.
2.1 Watch Time — The Algorithm’s Favorite Metric
What it is:
Watch time is the total number of minutes viewers spend watching your videos. YouTube’s system uses watch time as a primary ranking signal — videos with high watch time are more likely to be recommended.
Why it’s important:
- Drives discovery and recommendations
- Helps with monetization eligibility (4,000+ watch hours required annually)
- Shows overall content value
Actionable steps to improve watch time:
✔ Create strong hooks in the first 8–15 seconds.
✔ Structure videos so value is delivered throughout.
✔ Use playlists to increase session duration.
✔ Encourage binge-watching with linked videos at the end.
✔ Reuse high-performing formats across multiple videos.
2.2 Audience Retention — Where Viewers Drop Off
Audience retention charts show exactly where viewers stop watching your video. This helps you identify problem areas in your pacing or structure.
Why retention matters:
- YouTube rewards videos that keep people watching longer.
- Most videos lose 55%+ of viewers within the first 60 seconds.
Retention Patterns & How to Fix Them:
| Retention Pattern | What It Signals | How to Fix |
| Sharp early drop | Weak hook or slow start | Improve intro, preview value immediately |
| Gradual decline | Content loses interest | Add engaging segments, interactive elements |
| Mid‑video spike | High engagement parts | Replicate this style, extend similar content |
| End drop-off | Weak closing or CTA | Add end cards, strong calls-to-action |
Improvement tips:
✔ Introduce pattern interrupts (visual changes, questions).
✔ Avoid long intros and unnecessary padding.
✔ Use storytelling techniques to keep viewers engaged.
✔ Experiment with pacing, music, and visuals for attention retention.
2.3 Click‑Through Rate (CTR) — Your Visibility Engine
CTR tells you how often people click your video after seeing the thumbnail and title.
Good benchmarks:
- 2–10% CTR is common for most creators.
- 4–6% is usually considered a healthy range for many niches.
Why it matters:
A strong CTR signals to YouTube that your thumbnail and title resonate, prompting more recommendations.
Action steps to improve CTR:
✔ Test multiple thumbnail designs.
✔ Include keywords in titles.
✔ Use bold, contrasting colors.
✔ Match thumbnail promise with actual content.
✔ Monitor CTR trends weekly and tweak designs accordingly.
2.4 Traffic Sources — Where Your Views Come From
Traffic sources show how viewers discover your videos: Search, Suggested Videos, Browse features, external links, etc.
Traffic Source Tips:
- Search traffic: Use targeted keywords in titles/descriptions.
- Suggested traffic: Optimize watch time and retention.
- Browse features: Create content series to encourage returning viewers.
- External traffic: Promote videos on social media or email newsletters.
Bullet list:
✔ Identify which traffic source brings the most engaged viewers.
✔ Adjust your content strategy to prioritize high-retention sources.
✔ Track changes over time to see which new content formats perform best.
3. How to Interpret Your Analytics Like a Pro
3.1 High CTR but Low Retention
- Clicks happen, but viewers leave early.
- Fix: Align thumbnail/title with actual content.
3.2 Steady Impressions but Flat Views
- People see your video in feeds but don’t click.
- Fix: Test more compelling thumbnails or wording.
3.3 Watch Time Rising but Engagement Low
- People watch but don’t comment, like, or share.
- Fix: Include questions, polls, or CTAs to boost engagement.
✔ Use bullet lists to highlight symptoms and corrective actions.
4. How Often to Review Your Analytics
🔹 Daily Checks
- CTR changes
- Early watch time signals
- Real-time engagement trends
🔹 Weekly Reviews
- Retention and watch time patterns
- Best and worst-performing videos
- Traffic source shifts
🔹 Monthly Deep Dives
- Track long-term engagement trends
- Benchmark against past months
- Identify best-performing content themes
✔ Bullet list format ensures beginners know exactly what to monitor each period.
5. Actionable YouTube Analytics Checklist
Here’s your go-to checklist to turn analytics into actions:
✔ Open YouTube Analytics
✔ Track watch time trends across videos
✔ Review audience retention for drop-off points
✔ Analyze CTR for thumbnails/titles
✔ Study traffic sources
✔ Compare performance month-over-month
✔ Adjust content plan based on insights
✔ Plan future videos using data patterns
This checklist is your data-driven roadmap to smarter content decisions.
6. Case Studies — Real Data, Real Improvement
6.1 Case Study 1 — Watch Time Optimization Wins
- Problem: Viewers dropped off in first 15 seconds
- Solution: Improved hook and first 30-second preview of video
- Result: +30% average watch time, +15% retention
6.2 Case Study 2 — CTR Boost with Thumbnail Redesign
- Problem: CTR was only 2.5%
- Solution: Redesigned thumbnail with contrasting colors and clear text
- Result: CTR increased to 6%, video recommended more often
✔ Use bullet lists in each case study for clarity.
7. FAQ — Answers to What Beginners Search For
Q1: What is YouTube Analytics and why is it important?
YouTube Analytics is your window into viewer behavior — tracking watch time, retention, CTR, and traffic sources to help guide content strategy.
Q2: Which metrics should I focus on first?
Start with watch time, audience retention, and CTR — these are most predictive of growth.
Q3: How do I improve watch time?
Strong hooks, structured pacing, playlist use, and storytelling techniques improve watch time.
Q4: What’s a good CTR for beginners in 2025?
Around 4–6%, but it varies by niche and content type.
Q5: Why am I getting impressions but not many views?
Likely the thumbnail/title needs improvement — impressions show reach, views show engagement.
Q6: How often should I check analytics?
Daily for quick trends, weekly for patterns, monthly for strategy adjustments.
Q7: Can analytics help plan new video topics?
Yes — traffic sources and retention patterns reveal what topics attract and retain viewers.
8. Conclusion — Data That Drives Decisions
YouTube Analytics is more than numbers — it’s a map to growing your channel strategically. Focusing on watch time, retention, CTR, and traffic sources will help you produce content that truly resonates.
💡 Next step: Open YouTube Studio today and check your watch time and retention graphs. Implement one actionable improvement this week and track results.