Visual Storytelling Examples: Learn Powerful Content Methods
Stop scrolling — this article will show you exactly how to turn one image, short video, or data chart into a story people remember, share, and buy from.
Why read this?
- You’ll discover practical, copy-ready visual storytelling formats.
- You’ll learn how visuals increase engagement, retention, and conversions.
- You’ll get a simple 5-step template you can use today.
- All ideas are backed by recent research and real-world marketing data (so you know they work).
What is Visual Storytelling?
Visual storytelling happens when you use something other than words to tell a story. You can use images, videos, data graphics and different layouts and designs to communicate your message.
Visual storytelling helps your message:
- resonates emotionally
- inform clearly
- inspires action
In visual storytelling you are creating a story arc that has standard structure even if it’s an image, the structure is:
- beginning (context)
- middle (challenge)
- end (resolution or call to action)
Core elements of a strong visual story:
- A “hero” (person, product, or subject) that people can relate to
- A conflict or problem that resonates with your audience
- A visual arc: build tension or curiosity, then resolve it or deliver clarity
- Sensory cues: color, contrast, motion, layout — design details that draw the eye
- A call to action (even simple): subscribe, share, buy, learn more
A good visual story engages the audience. It helps make information memorable, emotional, and shareable.
Why Visuals Outperform Plain Text (Stats & Science Behind It)
People take in visuals faster and remember them more than plain text. That’s why visual content consistently outperforms text-only content across engagement, retention, and conversion metrics.
- Posts or articles with images get significantly more views than those without.
- Visual content boosts engagement rates, social posts with visuals often perform many times better than text-only posts.
- Visuals aid retention: information paired with images is remembered far longer than text alone.
- On landing pages, using video or strong visuals can increase conversion rates.
Bold truth: Text alone explains. A visual story is emotionally remembered & shared.
Quick Comparison: Which Visual Format Performs Best?
| Format | Engagement / Shares | Retention / Time | Conversions / Business Impact |
| Static Images & Infographics | ~2.3× higher post engagement; 2× more shares. | ~30% longer page time; 65% more info retained vs text. | ~12% traffic lift. |
| Video | Up to 1,200% more shares than text + image. | ~95% message retention vs ~10% reading. | 25–80% conversion lift. |
| Interactive / Data-Viz | ~52.6% higher engagement than static. | Faster comprehension; better retention. | Highest credibility for complex topics. |
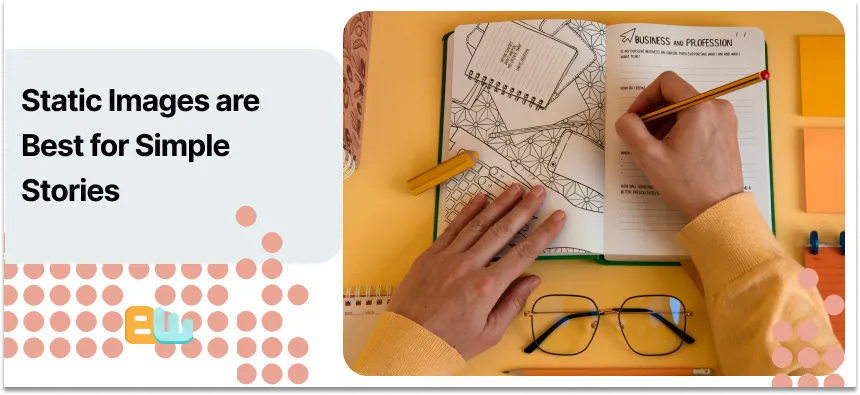
Static Images & Infographics — Best for Simple, Quick Stories
Fast facts you can steal for your next presentation or pitch:
- Images boost engagement by up to 2.3×
- Articles with images every 75–100 words: 2× more shares
- People remember 65% of info with visuals vs 10% with text-only
- Infographics can increase traffic by ~12%
When this format works best:
➡ Small business marketing
➡ Step-by-step how-to posts
➡ Recaps, stats summaries
➡ Brand storytelling without expensive production
The psychology is simple: the human brain processes visual information quickly, draws emotional meaning, and stores it more durably. As a small business owner or content creator, that means visual storytelling isn’t optional, it’s powerful, efficient, and essential.
7 Visual Storytelling Examples You Can Copy (with mini case studies & micro-templates)
Want real-world ideas you can adapt tomorrow? Here are seven visual storytelling formats, each with why it works, what to track, and a quick “copy-this” plan.
1. Hero Product Video / Brand Film
A short video (30–60 s) that presents your product or brand as the “hero,” not just features. Show real people, real problems, real emotions.
Why it works: Humans connect with motion and emotion; video builds greater empathy than a static image. Brands that use story-driven video often see stronger engagement and deeper brand affinity. (Source)
Track: Watch time, view-through rate, click-through / conversion after video.
Your template:
- Shot 1: introduce hero (person / customer / your brand)
- Shot 2: show the problem or desire
- Shot 3: reveal the product/service as solution + emotional payoff
- End with brand message and call to action
2. Interactive Data Story / Scrollable Visual Narrative
Use data, charts, scroll-triggered effects or interactive modules to tell a story. Think “as you scroll, the story unfolds.”
Why it works: Interactive storytelling engages readers more deeply. It simplifies complexity and invites exploration, strong for data, statistics, before/after, trends.
Track: Time on page, scroll depth, engagement (clicks, interactions), shares.
Your template:
- Intro: headline + context + hook
- Data/visual scene 1: baseline
- Data/visual scene 2: reveal key insight / shift / contrast
- Conclusion: actionable takeaway or call to explore more
3. User-Generated Content (UGC) Carousel / Visual Series
Showcase real customers, user photos or real-life uses: a series of images (or short clips) that together tell a story.
Why it works: Authentic visuals build trust — people relate more to real people than staged stock photos. Plus social proof often converts better.
Track: Engagement (likes/comments/shares), conversions from social to website, UGC submissions / community growth.
Your template:
- Ask customers to share photos or stories with your product
- Curate 4–6 of the strongest visuals
- Add short captions: customer name (optional), challenge → experience → result
- Post as carousel / gallery to show progression and authenticity
4. Short Social Video / Micro-Episode (e.g. for Instagram, TikTok)
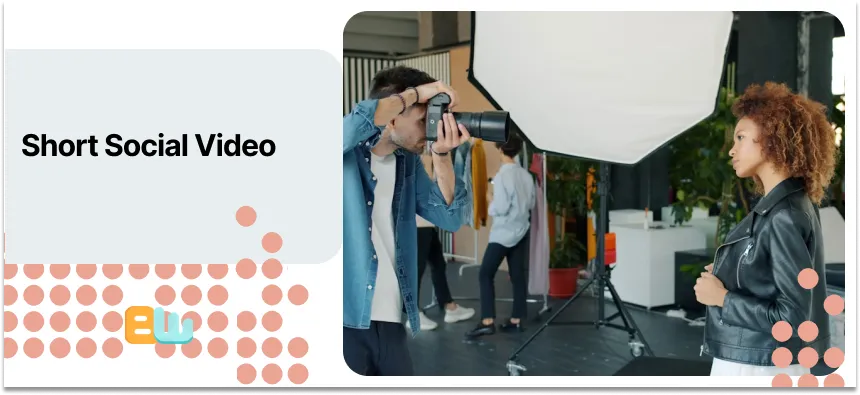
Produce 3–5 short “episodes” , each a 10 to 30s video, that together build a mini-narrative about your brand or product.
Why it works: Short-form visuals match fast-scrolling behavior. They hook fast and deliver bite-sized stories people can digest and share. Emerging platforms reward this format heavily. (Source)
Track: Completion rate, shares, follower growth, conversion / click after video (e.g. link in bio).
Your template:
- Episode 1: Present problem or relatable “pain point”
- Episodes 2–3: Show attempts, use-case, behind-the-scenes or transformation
- Final episode: Reveal solution (your brand / product) + CTA
5. Before/After Visuals or Data Visualization for Proof
Use “before vs. after” images, charts, side-by-sides, or slider visuals to show transformation or results.
Why it works: Concrete visual proof builds credibility more than words. Especially powerful for services or transformations (makeovers, upgrades, metrics improvements).
Track: Conversion lift, click-through, share rate (people love to share “wow” transformations).
Your template:
- Left side: “before” — problem / baseline / current state
- Right side: “after” — results / benefits / improved state
- Add a short caption summarizing the outcome
6. Illustrated Storyboard / Comic-Style Product Journey
Visualize a user’s journey (or a customer’s problem → solution) via illustration or comic-style storyboard.
Why it works: When the subject is abstract or complex (processes, services, abstract benefits), illustrations + storyboarding make it tangible and digestible.
Track: Engagement (time on page, shares), comprehension metrics (if you survey), click-through for deeper content.
Your template:
- Frame 1: Character + problem
- Frame 2: Conflict or challenge (sub-problem)
- Frame 3: Solution (product / service) + emotional benefit
- (Optional) Frame 4: CTA or next step
7. Cinematic Landing Page (Video Header + Narrative Copy)
Transform your landing page into a mini-film: background video or hero image + narrative copy that reads like a story, not a sales pitch.
Why it works: First impressions count. A cinematic intro builds immersion, draws visitors in, and primes them to explore, especially effective for high-intent or premium products. (Source)
Track: Bounce rate, time on page, conversion rate, scroll depth.
Your template:
- Hero video/image + compelling headline (the “hook”)
- Short narrative copy: problem → pain → promise → solution
- Social proof / testimonials / visuals showing benefit
- Clear call to action (button, form, link)
How to Build Your Own Visual Story — 5 Step Template
Follow these five steps to turn any idea into a visual story.
- Define your hero & conflict
- Who are you talking to (audience / persona)?
- What problem or desire do they have?
- Who are you talking to (audience / persona)?
- Choose a visual format
- Video for emotion, storytelling, human connection
- Data viz / interactive for proof, insight, complexity
- UGC for trust, authenticity & social proof
- Illustration / storyboard for abstract ideas
Use bold thinking: Pick the format that fits the story goal, not vice versa.
- Video for emotion, storytelling, human connection
- Storyboard your key beats (3–4 frames or scenes)
- Setup (hero & problem) → tension or conflict → resolution / payoff → call to action
- Setup (hero & problem) → tension or conflict → resolution / payoff → call to action
- Produce modular assets
- Create multiple versions (square, vertical, thumbnail) for different platforms
- Use consistent branding (colors, fonts, style) for cohesion and recognition
- Create multiple versions (square, vertical, thumbnail) for different platforms
- Publish, measure & iterate
- Track KPIs: watch time, scroll depth, engagement, click-through, conversions
- Use results to refine visuals / story / format
- Track KPIs: watch time, scroll depth, engagement, click-through, conversions
These steps give you an easy-to-follow, repeatable process — ideal for small teams or solo creators.
Which Format Should You Use, and When?
Not every format fits every goal. Here’s a quick guideline table to help you decide what to use based on what you want to achieve:
| Visual Format | Best Use Case (When It Performs Best) | Primary KPI to Track |
| Static Images / Graphics / Infographics | – Summarizing data or steps – Brand storytelling – Creating skimmable social content – Recaps and quick teaching pieces | Engagement rate (likes, comments) Share rate Scroll depth/read time |
| Video Content (Short or Long Form) | – Product demonstrations – Testimonials & emotional stories – Launch campaigns- Conversion-focused ads | Video views & completion rate Conversion rate (sign-ups, purchases) Click-through rate |
| Interactive / Data-Visualization / Tools | – Explaining complex processes – ROI calculators & configurators – Case studies & reports – Sales enablement content | Time on page Lead quality & form submissions Interaction/click events |
Quick recommendations:
- Video — best for emotional storytelling and brand connection.
- Interactive / Data viz — ideal when you need to explain complex facts, show evidence, or encourage exploration.
- Infographics / Static Images — good for quick tips, shareable content, and readability.
- UGC / Social Carousels — powerful for authenticity, building community trust, and social proof.
Your choice should depend on your goal, which one do you want?
awareness, trust, education, conversion, or engagement.
Conclusion & What to Do Next
Visual storytelling is not another fancy new trend in marketing, it is the science behind viralism and the real shortcut to improving audience engagement. Choosing the right format that fits your story and brand will give you a way to tell stories that leave an impression and drive action.
Wondering what to do next?
- Choose one of the 7 examples we’ve provided you with
- Use the easy 5 step template
- Create your first story
- Test it and analyze the result
- Improve based on the performance
If you are consistent and add a little creative twist, visual story telling can be your secret weapon to propel your business to new heights. The best part is that visual story telling has been proven effective by both research and real brand success so do not hesitate to jump in on the train and jump start your success.
FAQ — Common Questions About Visual Storytelling
What exactly is visual storytelling?
It’s using visuals (images, video, data, design) plus narrative structure (hero → problem → solution) to communicate a message more emotionally, clearly and memorably.
How do I measure if a visual story worked?
Key metrics: watch time (for video), scroll depth (for interactive), engagement (likes/shares/comments), click-throughs, conversion lift.
What formats work best on social media?
Short videos, carousels/user-generated content, infographics, and visually consistent images tend to perform best — especially formats that match the platform’s style (vertical video for TikTok/Instagram, carousels for feeds, etc.).
Does shorter always mean better (for visual stories)?
Not always — but shorter often helps on social. For deeper stories (on blog or landing page), slightly longer visuals (interactive, video + copy) can build more immersion and trust.