Introduction to Social Media A/B Testing
You’ve probably heard it before: “A/B testing is essential for social media success.” But here’s the uncomfortable truth – according to recent studies, up to 76% of marketers are doing it wrong.
I’ve analyzed hundreds of social media campaigns and found something shocking: most teams are wasting time and resources on tests that deliver misleading data.
Think about it. When was the last time your A/B test actually transformed your social strategy? If you’re struggling here, you’re not alone.
In this guide, I’ll show you exactly where most marketers go wrong with social media A/B testing and how to fix these issues to get authentic, actionable insights that boost engagement, conversions, and ROI.
The Fundamentals of Effective Social Media A/B Testing
A/B testing on social media isn’t just about trying two different images to see which gets more likes. It’s a scientific method of running controlled experiments to determine which content creates higher engagement among the audience.
The essence is simple: create two nearly identical versions of content, changing just one element, show them to similar audience segments, and analyze which performs better against your specific goals.
What makes social media A/B testing unique is the platform environment. On Facebook, you might test ad copy length; on Instagram, the filter you use might be variable. LinkedIn needs professional tone testing, while TikTok might require different video hooks.
The scientific approach remains constant across platforms:
– Form a clear hypothesis
– Create controlled variations
– Gather sufficient data
– Analyze results for statistical significance
– Implement findings
– Repeat
This methodical approach is where most marketers get confused. Let’s look at why.
5 Common Mistakes Marketers Make When A/B Testing
Testing Too Many Variables Simultaneously
I recently reviewed a Facebook campaign in which a marketing team tested different images, headlines, body copy, and CTAs simultaneously.
Their conclusion? The variation with a product image performed 15% better than a lifestyle image. But was it the image that made the difference? Or was it the completely different headline they used?
When you change multiple elements, you can’t identify which specific factor influenced results. This is like determining which ingredient improved a recipe after changing five ingredients.
Solution: Change only one variable at a time. Want to test images? Keep everything else the same. This is the only way to know exactly what’s making the difference.
Reaching Conclusions With Insufficient Data
“Our tweet with the question mark got 6 retweets while the exclamation point version only got 2. Questions work better!”
Sound familiar? This is a classic case of making decisions based on woefully inadequate sample sizes.
In a study of marketing decision-makers, 65% admitted to implementing changes based on tests with fewer than 100 total conversions – far below what’s needed for statistical confidence.
Solution: Use a sample size calculator before starting your test. You’ll need hundreds (sometimes thousands) of impressions before getting accurate conclusions for most social media campaigns.
Ignoring Statistical Significance in Test Results
I once saw a marketer celebrate a “winning” ad that performed 5% better than the control version. The problem? The test had only a 60% confidence level – meaning there was a 40% chance the result was pure coincidence.
Without statistical significance (typically 95% confidence or higher), you make decisions based on random chance.
Solution: Use tools like Optimizely’s significance calculator to verify your results aren’t just noise. Don’t implement changes unless your confidence level exceeds 95%.
Failing to Define Clear Hypotheses Before Testing
Many marketers approach testing backward: “Let’s try a few different things and see what happens.”
Without a specific hypothesis, you’ll struggle to design a proper test or analyze results meaningfully. You need a clear prediction: “I believe changing our CTA from ‘Learn More’ to ‘Get Started’ will increase click-through rates by at least 10% because it creates more urgency.”
Solution: Document your hypothesis with an expected outcome and reasoning before any test. This forces disciplined thinking and prevents after-the-fact rationalization.
Misinterpreting Results Based on Confirmation Bias
We’re all interested in seeing what we want to see. If you’ve invested in a particular creative direction, you might unconsciously choose data that supports your preference.
One marketing director I consulted with insisted their emoji-filled captions performed better, even though the data showed their engagement rate was actually 12% lower.
Solution: Have someone who wasn’t involved in creating the variations review the results. Their fresh perspective can help overcome bias.
How to Set Up a Proper Social Media A/B Test
Identifying Meaningful Metrics Worth Testing
Not all metrics deserve your testing resources. While vanity metrics like likes feel good, they rarely translate to business outcomes.
Instead, focus on metrics that connect to your business goals:
– For brand awareness: Reach, impressions, and share rate
– For engagement: Click-through rate, comments, and saves
– For conversions: Lead form completions, sign-ups, and purchases
– For retention: Return visitor rate and repeat engagement
The key is asking: “If this metric improves, will our business results improve?” If not, it’s probably not worth testing.
Creating Truly Comparable Test Variations
Your variations must be almost the same except for the one element you’re testing. This ensures any performance difference can be attributed to that single variable.
For example, when testing video length on Instagram:
– Same opening hook
– Same subject matter
– Same call-to-action
– Same posting time
– Only difference: One video is 30 seconds, one is 90 seconds
Determining Appropriate Sample Size for Reliability
Small sample sizes lead to unreliable results. Before starting any test, calculate the number of impressions you’ll need.
As a rough guideline:
– For major changes (new creative concept): 1,000+ impressions
– For moderate changes (headline testing): 2,000+ impressions
– For subtle changes (button color): 5,000+ impressions
The smaller the expected effect, the larger your sample size needs to be.
Setting the Right Timeline for Conclusive Results
Running tests for a very short time leads to timing bias. A LinkedIn post might perform differently on Monday morning in compare to Friday afternoon.
Most social media A/B tests should run for at least:
– 7 days for ads and promoted content
– 3-5 posting cycles for organic content
– Full business cycles for seasonal businesses
This ensures you capture different audience behaviors throughout the week.
Isolating Variables to Ensure Valid Outcomes
Control all external factors that might skew results. This means avoiding:
– Testing during unusual periods (holidays, major news events)
– Changing other marketing activities during the test
– Comparing content aimed at different audience segments
– Running multiple tests that might influence each other
Platform-Specific A/B Testing Strategies That Work
Facebook: Optimizing Ad Creative and Audience Targeting
Facebook’s robust testing tools make it ideal for sophisticated experiments. Focus on:
– Creative testing: Use dynamic creative testing to automatically test multiple headlines, descriptions, and images
– Audience testing: Split your custom audiences into two similar segments
– Placement optimization: Test in-feed ads against right column or Marketplace
Pro tip: Use Facebook’s A/B testing tool rather than manually creating separate ad sets. This ensures the algorithm doesn’t optimize one variation over another during the test.
Instagram: Testing Visual Elements for Maximum Engagement
Instagram is primarily visual, so focus testing efforts on:
– Filter vs. no filter (studies show filtered images get 21% more views)
– Single image vs. carousel posts
– Regular posts vs. Reels (currently seeing 22% higher engagement)
– Caption length (short vs. detailed storytelling)
Remember that Instagram’s algorithm prefers content that keeps users on the platform, so test elements that increase view duration and saves.
LinkedIn: Refining Professional Content for Conversion
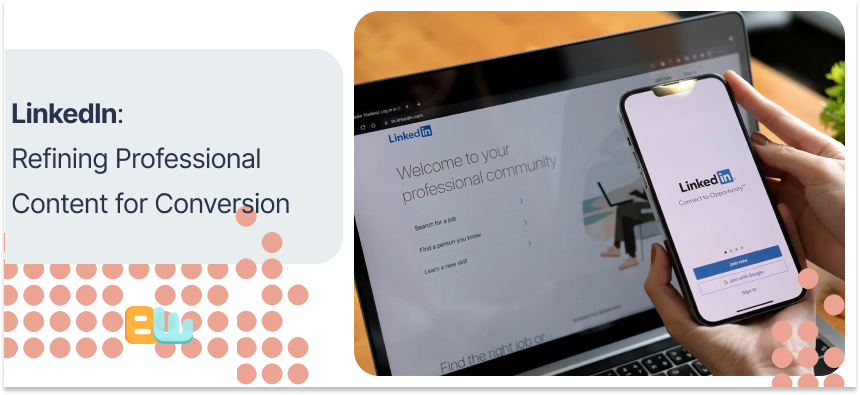
LinkedIn’s B2B audience responds differently than other platforms:
– Test formal vs. conversational tone
– Compare list-format posts against narrative stories
– Document posts vs. regular updates (documents currently get 3x the click-through rate)
– Test timing: Tuesday-Thursday typically outperforms Monday/Friday
Unlike other platforms, LinkedIn users often appreciate longer, more detailed content if it provides professional value.
Twitter: Perfecting Message Clarity in Limited Characters
Twitter’s character limitation requires precision testing:
– Test question formats vs. statement formats
– Compare tweets with/without hashtags (studies show 1-2 hashtags is optimal)
– Test different thread lengths
– Compare text-only vs. text with media
Timing is crucial on Twitter – test posting during breaking news vs. quieter periods to find your sweet spot.
TikTok: Experimenting with Trends and Video Formats
TikTok’s algorithm rewards watchtime and completion rate:
– Test different video lengths (15 seconds vs. 60 seconds)
– Compare trending sound usage against original audio
– Test direct address (talking to camera) vs. voiceover style
– Compare hook styles: question-based, statement-based, or visual pattern interrupt
TikTok is unique because content discovery isn’t just follower-based – test creating content for the algorithm versus your existing audience.
Advanced A/B Testing Techniques for Social Campaigns
Multivariate Testing: When and How to Implement
While A/B testing examines one variable, multivariate testing evaluates multiple variables simultaneously to understand both individual impacts and interactions.
This is powerful for social ads where headline, image, and CTA might have complicated effects. For example, a friendly tone might work better with casual images but worse with professional ones.
When to use it: Only when you have enough traffic to support multiple combinations (typically 10,000+ impressions) and want to understand complex variable interactions.
Sequential Testing: Building Upon Previous Results
Instead of testing everything at once, sequential testing builds on previous findings:
1. Test headline variations to find a winner
2. Keep the winning headline and now test images
3. Keep the winning headline and image, then test CTAs
This approach requires more time but allows testing with smaller audiences and builds on proven elements.
Adaptive Testing: Responding to Real-Time Insights
Traditional A/B tests set parameters beforehand and run until completion. Adaptive testing adjusts based on early signals.
For example, if after two days one variation is underperforming by 30%+, you might reallocate budget to the better performer while introducing a new challenger.
This works particularly well for time-sensitive campaigns like product launches or event promotions.
Segmented Testing: Personalizing for Different Audiences
The same content often performs differently across different audiences. Segmented testing divides your audience and performs separate tests for each group.
You might discover that video testimonials outperform product demos for new prospects, while existing customers prefer feature highlights.
7 Tools That Simplify Social Media A/B Testing
1. Facebook Experiments: Built-in A/B testing for ads with statistical confidence reporting.
– Pros: Free, integrated with ad manager
– Cons: Limited to Facebook-owned properties
– Price: Free with ad spend
2. Optimizely: Enterprise-level testing platform with advanced statistical analysis.
– Pros: Comprehensive testing capabilities across channels
– Cons: Significant learning curve, expensive
– Price: $50,000+ annually
3. VWO: Mid-market testing tool with social media integration.
– Pros: User-friendly interface, good statistical analysis
– Cons: Limited social-specific features
– Price: $199-$999/month
4. Hootsuite Impact: Social-specific testing with analytics dashboard.
– Pros: Purpose-built for social media, integrates with posting tools
– Cons: Limited statistical rigor
– Price: Custom pricing, typically $500-$1000/month
5. SproutSocial: Social management platform with A/B capabilities.
– Pros: All-in-one solution, good for small teams
– Cons: More basic testing options
– Price: $249-$499/month
6. Google Optimize: Free testing tool that integrates with Google Analytics.
– Pros: Free, robust analytics connection
– Cons: Not specifically designed for social campaigns
– Price: Free
7. Split.io: Developer-focused testing platform for more technical teams.
– Pros: Highly customizable for specific testing needs
– Cons: Requires technical implementation
– Price: $166-$2000/month
Measuring and Analyzing Your A/B Test Results
Interpreting Data Beyond Surface-Level Metrics
The test showed variation B got a higher CTR. Great! But that’s just the beginning of proper analysis.
Dig deeper into secondary metrics:
– Did the higher CTR lead to more conversions?
– How did time-on-site compare between variations?
– Did one variation attract different audience segments?
– Did performance differ across devices or regions?
The most valuable insights often come from unexpected patterns in the data.
Translating Test Results into Actionable Strategies
A test is only valuable if you act on it. For each conclusive test, create:
1. A summary of what was learned
2. Why you believe the result occurred (the underlying principle)
3. How this insight can be applied to other content
4. Specific next steps for implementation
For example, if emoji-filled captions work better than plain text, your action might be to update your content calendar to include relevant emojis in all future posts.
Avoiding Statistical Pitfalls in Analysis
Even with proper test setup, analysis errors are common:
– Correlation vs. causation: Just because two metrics moved together doesn’t mean one caused the other
– Ignoring confidence intervals: The “true” result typically falls within a range
– P-hacking: Running analyses until you find something “significant”
– Overlooking external factors: A major news event might have skewed results
Always ask: “What else could explain this result besides our test variable?”
Creating Reporting Frameworks for Stakeholders
Non-technical stakeholders need clear summaries. Create a standardized reporting template:
1. Test hypothesis (what we thought would happen)
2. Test design (what we actually tested)
3. Results summary with visual representation
4. Statistical confidence level (how sure we are)
5. Business impact (what this means in revenue/goals)
6. Recommended next actions
Visual representation is critical for creating clear charts that show not just differences but confidence intervals.
Case Studies: Successful Social Media A/B Testing
How Brand X Increased Engagement by 45%
A mid-sized beauty brand was struggling with declining Instagram engagement. Their typical posts received 1.2% engagement (likes + comments divided by followers).
Their hypothesis: Their highly polished product photography created a distance between the brand and customers.
The test:
– Control: Traditional studio product photography
– Variation: User-generated content featuring diverse customers using products
Results:
– UGC posts received 45% higher engagement
– Comment sentiment analysis showed stronger emotional connection
– Save rate (a key Instagram algorithm signal) increased by 63%
Implementation:
The brand shifted to 70% UGC content and created a branded hashtag campaign to source more authentic content, ultimately driving a 22% increase in direct sales from Instagram.
The Small Business Approach to Cost-Effective Testing
A local restaurant with limited marketing resources needed to improve their Facebook results without increasing ad spend.
Their methodical approach:
1. First test: Image type (food close-ups vs. people enjoying meals)
Result: People-focused images drove 27% higher CTR
2. Second test: Headline focus (price promotion vs. emotional experience)
Result: Experience-focused headlines performed 18% better
3. Third test: CTA (“Order Now” vs. “View Menu”)
Result: “View Menu” increased website visits by 34%
By repeatedly building on each test, they optimized their Facebook strategy while staying within budget limits. The combined improvements led to a 52% increase in online orders.
Enterprise-Level Testing That Transformed ROI
A B2B software company was spending $50,000 monthly on LinkedIn ads with disappointing results. Their testing strategy focused on content format rather than traditional elements.
The test matrix included:
– Downloadable guides vs. interactive assessments
– Case studies vs. industry reports
– Video testimonials vs. product demonstrations
The surprising finding? Despite having lower click-through rates initially, Interactive assessments outperformed all other content types by 3.5x for lead generation.
Further segmented testing revealed this content type performed well with C-suite decision-makers, allowing the company to reallocate the budget toward their highest-value audience segment.
The result: 134% increase in qualified leads while reducing overall ad spend by 20%.
Conclusion: Building a Culture of Testing
A/B testing isn’t just a marketing tactic—it’s a mindset that transforms theories into knowledge.
The most successful social media teams don’t just run random tests; they integrate testing into every campaign. They question assumptions, form clear hypotheses, and let data guide their decisions.
Start small. Pick one element of your social strategy that’s underperforming and design a simple test. Document your process and share results with your team.
As you build your testing muscles, you’ll develop a competitive advantage that can’t be copied: deep, specific knowledge about what aligns with your unique audience.
Remember, the goal isn’t to follow best practices—it’s to discover what works best for your brand on each platform. Every audience is different, and the only way to know what works for yours is to test.
The marketers who win on social media aren’t those with the most significant budgets—they’re the ones who test smarter.
FAQs About Social Media A/B Testing
How long should I run a social media A/B test?
Most tests should run for at least 7 days to account for day-of-week differences. For seasonal businesses, consider running through a full business cycle.
What sample size do I need for reliable results?
For most social media tests, aim for at least 1,000 impressions per variation, with 100+ engagements for engagement-focused tests or 50+ conversions for conversion-focused tests.
Can I test more than one element at a time?
While multivariate testing is possible, start with simple A/B tests changing just one element. This creates clearer insights and requires smaller sample sizes.
How do I know if my test results are statistically significant?
Use a statistical significance calculator (like those provided by Optimizely or VWO) and aim for at least 95% confidence before implementing changes.
What should I do if my test shows no clear winner?
A “tie” is still valuable information. It means the element you tested doesn’t strongly impact user behavior, so you can focus testing efforts elsewhere.
How often should I be running A/B tests on social media?
Ideally, you should always have at least one test running. Start with monthly tests and increase frequency as you build capacity and experience.
Should I test paid and organic social content differently?
Yes. Paid content often allows for more controlled testing environments and larger sample sizes. For organic content, focus on elements within your control (captions, posting times, content types) rather than algorithm-dependent factors.
